The US National Debt Visualized: Understanding $39 Trillion Through Time, Space, and Everyday Objects

March 20, 2026 · 10 min read
··
- The US national debt stands at $38.86 trillion as of March 2026—a number so vast that without visual comparisons and concrete examples, the human brain simply cannot process its scale
- Here's the truth: counting to one million takes 11.5 days
- Counting to one billion takes 31.7 YEARS
- Counting to one trillion takes 31,709 YEARS
- We owe 39 of those
The US national debt reached $38.86 trillion in March 2026, growing at $7.23 billion per day. If you stacked that many dollar bills, the tower would reach from Earth to the sun and back 20 times. Each American now owes $111,397. The interest payments alone—$981 billion annually—exceed what we spend on national defense or Medicare.
Key Takeaways
- One million seconds = 11.5 days. One billion seconds = 31.7 years. One trillion seconds = 31,709 years.
- At current growth rates, the US adds roughly $7.23 billion to the debt every single day—that's $255 million per hour, $4.25 million per minute, $70,843 per second.
- If you laid $38.86 trillion in dollar bills end-to-end, they would circle Earth's equator 151,150 times or stretch to the sun and back 20 times.
- Interest payments on the debt now cost $981 billion annually—more than defense spending ($873.5B) or Medicare ($874.1B)—and are projected to hit $2.1 trillion by 2036.
- The debt-to-GDP ratio stands at 128%, meaning the US owes more than its entire annual economic output for the first time since World War II.
Watch Out For
- ⚠The difference between million, billion, and trillion is not linear—it's exponential. Most people wildly underestimate the gap.
- ⚠Interest costs have tripled since 2020 due to both higher debt levels AND higher interest rates (from 1.5% to 3.4%).
- ⚠By 2036, the US will spend more on interest payments ($2.1 trillion) than on ALL of Medicare, Medicaid, and defense spending COMBINED.
- ⚠The debt grows faster than the economy: even if we balanced the budget tomorrow, compound interest alone would keep the debt rising.

The National Debt at a Glance
$38.86T▲
Total US Debt (March 2026)
$111,397
Debt Per US Citizen
$7.23B▲
Daily Increase
$981B
Annual Interest Payment (2025)
128%▲
Debt-to-GDP Ratio
31,709 yrs
Time to Count to 1 Trillion
US Treasury Fiscal Data, Joint Economic Committee, March 2026
The Core Problem: Your Brain Cannot Comprehend Large Numbers
Human brains evolved to understand quantities we can see, touch, and count: apples in a basket, people in a room, trees in a forest. We did not evolve to understand numbers in the trillions. When you hear "$38.86 trillion," your brain treats it roughly the same as "$38.86 billion" or even "$38.86 million." They all just register as "big number." This is why politicians can get away with adding trillions to the debt without public outcry—the scale is literally incomprehensible without tools to visualize it.
The difference between a million, a billion, and a trillion is not a matter of degree. It's a matter of kind. And the only way to understand the national debt is to break it down into units your brain CAN process: seconds, physical space, and everyday comparisons.
Million vs. Billion vs. Trillion: The Time Test
The clearest way to understand these numbers is through time. Specifically: how long would it take to count to each number, counting one number per second, 24 hours a day, 365 days a year, without stopping?
Counting to One Million: At one number per second, you'd reach one million in 1,000,000 seconds. That's 16,667 minutes. That's 278 hours. That's 11.5 days. Totally doable. You could count to a million in less than two weeks.
Counting to One Billion: One billion seconds is 1,000,000,000 seconds. That's 16,666,667 minutes. That's 277,778 hours. That's 11,574 days. That's 31.7 YEARS. You would start counting as a newborn and finish just after your 31st birthday. You'd miss your entire childhood, adolescence, and young adulthood.
Counting to One Trillion: One trillion seconds is 1,000,000,000,000 seconds. That's 16,666,666,667 minutes. That's 277,777,778 hours. That's 11,574,074 days. That's 31,709 YEARS. You would have started counting in 29,683 BCE—during the last Ice Age, before the invention of agriculture, cities, or writing.
The pyramids wouldn't be built for another 27,000 years. You'd still be counting today.
The US National Debt: $38.86 trillion. If you counted one dollar per second, it would take you 1,232,957 YEARS. That's 1.2 million years. Homo sapiens didn't even exist a million years ago.
Time to Count to Each Number (Years)
Counting one number per second, 24/7, without stopping
Mathematical calculation: 1 count per second = 31,536,000 counts per year
How Fast Is the Debt Growing? Per-Second Breakdown
The debt doesn't just sit there. It grows every single second of every single day. Here's what that growth looks like in real time:
Per Second: $70,843 In the time it takes you to read this sentence (about 5 seconds), the US debt increases by $354,215. That's more than the median US home price.
Per Minute: $4.25 million In the time it takes to brew a cup of coffee, the debt grows by the cost of a luxury mansion.
Per Hour: $255 million During a typical movie runtime (2 hours), the debt increases by over half a billion dollars.
Per Day: $7.23 billion Every 24 hours, the US adds more debt than the GDP of 75 countries.
Per Year: $2.64 trillion (as of March 2026) In one year, the debt grew by more than the entire GDP of France, the world's 7th largest economy.
US National Debt Growth (1980-2026)
The debt has grown exponentially, with sharp increases during recessions and crises
US Treasury Historical Debt Outstanding, FRED Economic Data, Joint Economic Committee

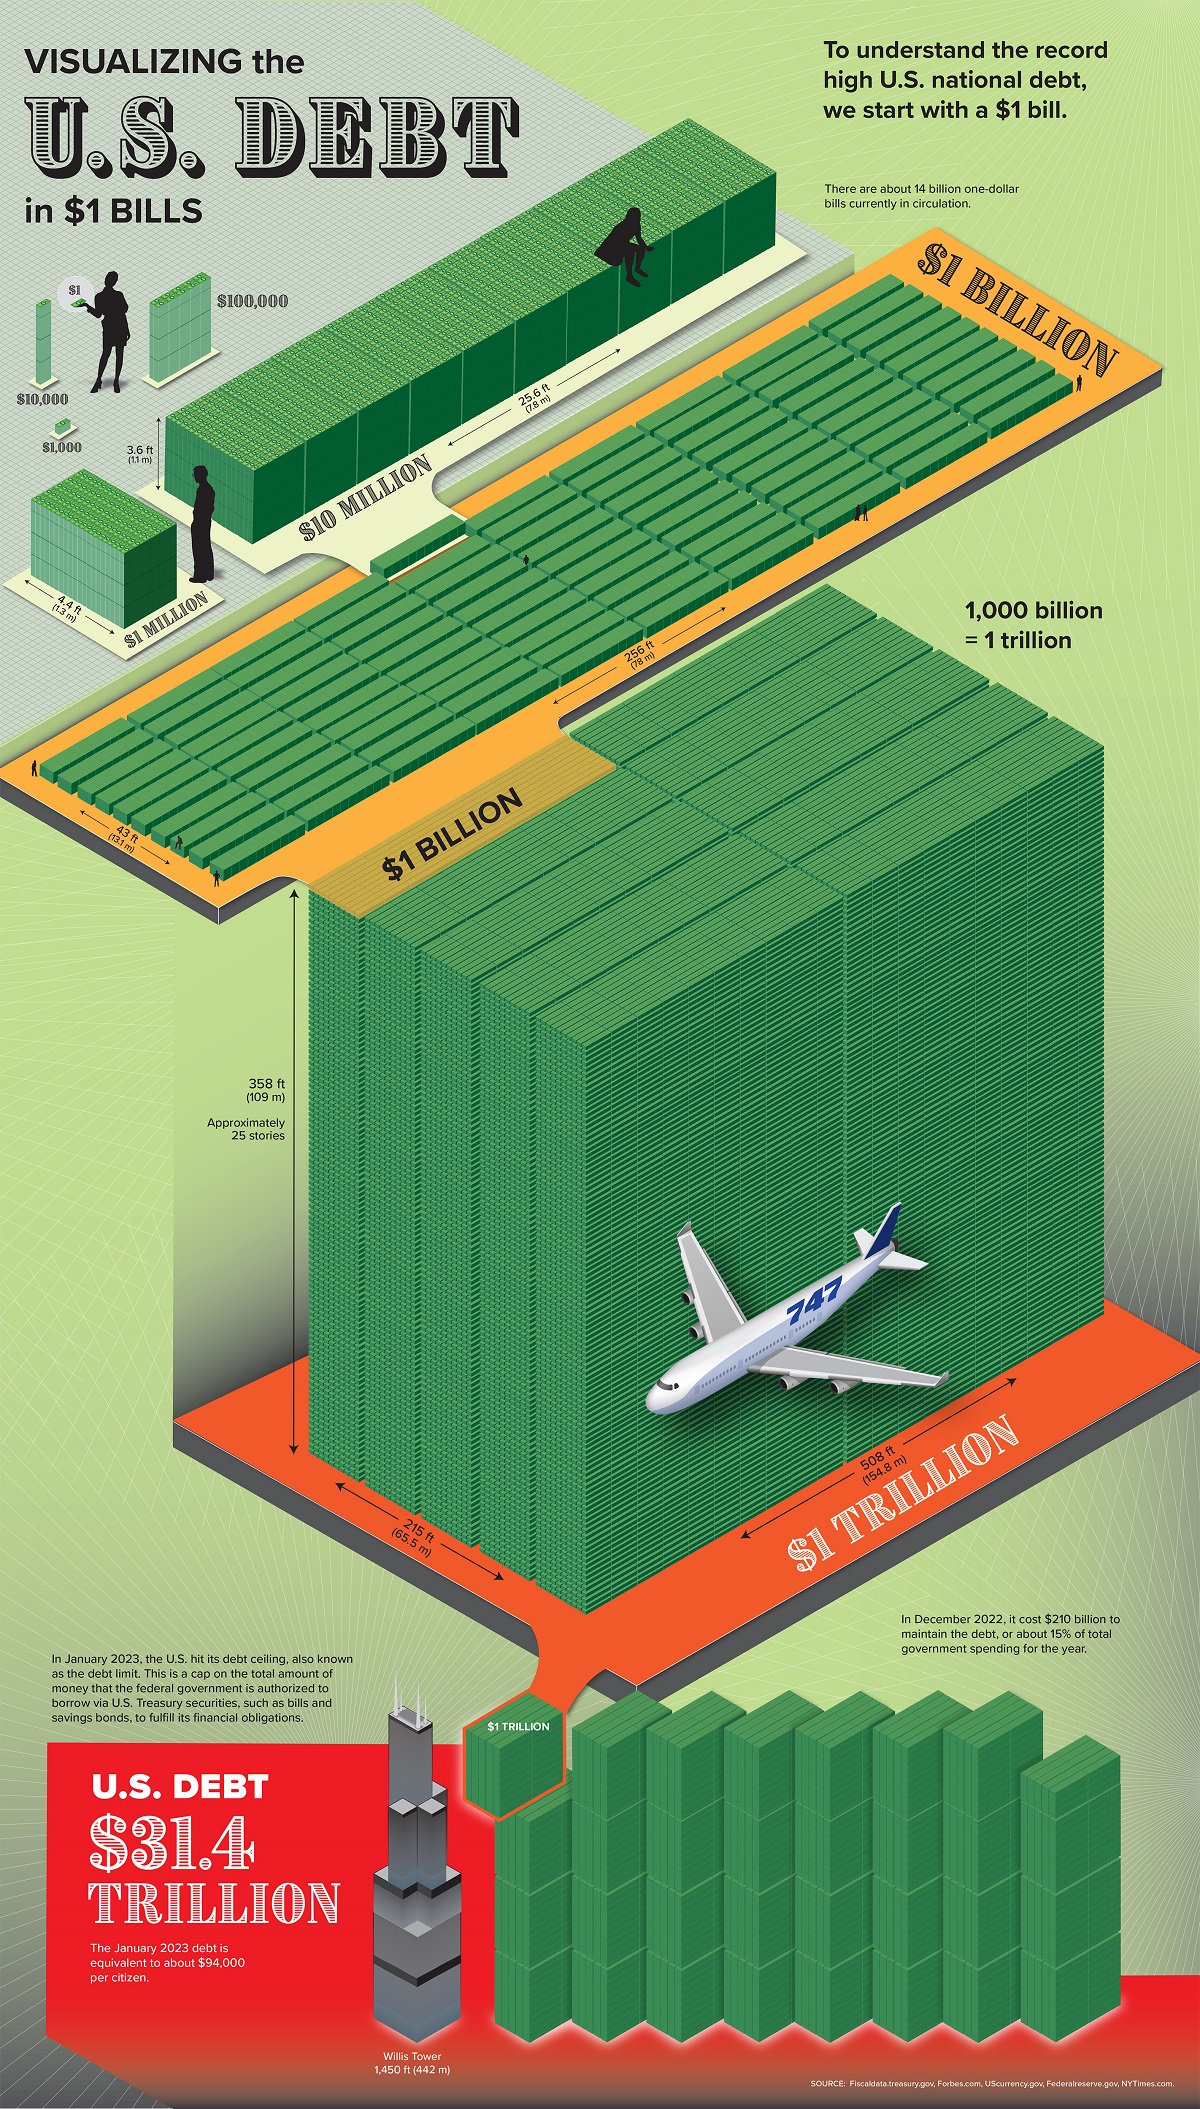
Physical Visualization: If the Debt Were Dollar Bills
Numbers on a screen still feel abstract. Let's make this physical. A single US dollar bill has very specific dimensions:
- Length: 6.14 inches (15.6 cm)
- Width: 2.61 inches (6.6 cm)
- Thickness: 0.0043 inches (0.109 mm)
- Weight: 1 gram
These measurements become critical when you try to visualize $38.86 trillion in physical bills.
Stacked Vertically (Height): If you stacked 38.86 trillion one-dollar bills on top of each other: - Total height: 167,098,000,000 inches - That's 13,924,833,333 feet - That's 2,637,508 miles - That's 279 times the distance from Earth to the Moon (238,900 miles) - Or 28 times the distance from Earth to the Sun (93 million miles)
To put this in perspective: the International Space Station orbits at 250 miles. Your stack of debt would reach the ISS 10,550 times over.
Laid End-to-End (Distance): If you laid 38.86 trillion one-dollar bills end-to-end: - Total distance: 238,520,400,000,000 inches - That's 19,876,700,000,000 feet - That's 3,763,194,697 miles - That's 151,150 times around Earth's equator (24,901 miles) - Or 20 round trips from Earth to the Sun
Total Weight: 38.86 trillion bills weighing 1 gram each: - Total weight: 38,860,000,000,000 grams - That's 38,860,000 metric tons - That's 191 times the weight of the Golden Gate Bridge (201,000 tons) - Or 6,476 times the weight of the Eiffel Tower (6,000 tons) - Or the weight of 5.5 million adult African elephants
Your stack of debt would reach the ISS 10,550 times over.
Debt Stacked in Dollar Bills: Height Comparisons
If $38.86 trillion were stacked as $1 bills, how high would it reach?
Calculation based on bill thickness of 0.0043 inches
Per-Person Breakdown: Your Share of the Debt
The US population is approximately 349 million people as of 2026. That means every man, woman, and child in America has a share of the national debt.
Debt Per Citizen: $111,397
That's more than: - The median annual household income in 37 US states - Four years of in-state tuition at a public university - A 20% down payment on a $550,000 home
Debt Per Household (average 2.5 people): $278,493
That's roughly: - The median price of a home in America - The total cost of raising two children from birth to age 18 - More than most Americans will save for retirement
But here's the key: You don't owe this money tomorrow. The government borrowed it on your behalf and will pay it back (theoretically) over time. The real problem is the interest.
US National Debt vs. Other Major Numbers
| Metric | Amount (Trillions) | % of Debt |
|---|---|---|
| US National Debt | $38.86 | 100% |
| US Annual GDP (2025) | $30.30 | 78% |
| Total US Household Net Worth | ~$150 | 386% |
| Global GDP (2025) | ~$110 | 283% |
| US Stock Market Value (All Exchanges) | ~$50 | 129% |
| Total US Currency in Circulation | $2.35 | 6% |

The Interest Payment Crisis: Paying $981 Billion Just to Service Debt
Here's where the debt becomes a real, immediate problem: interest payments. Just like a credit card, the US pays interest on its borrowed money. And those payments have exploded.
Annual Interest Payment (2025): $981 billion
That's: - $2.69 billion PER DAY in interest alone - More than the US spent on Medicare ($874.1B) in fiscal 2024 - More than the US spent on national defense ($873.5B) in fiscal 2024 - 13% of ALL federal spending - The third-largest federal budget item behind only Social Security and Healthcare
Why Interest Costs Exploded: Interest payments have nearly tripled since 2020 for two reasons:
1.
More debt:
$27.75 trillion (2020) → $38.86 trillion (2026)
Higher rates:
1.5% average (2020) → 3.4% average (2026)
When you combine doubling the debt with doubling the interest rate, you get a quadrupling of interest costs. And it's projected to get much worse.
Interest Payment Projections: - 2026: $1.0 trillion - 2030: $1.5 trillion (estimated) - 2036: $2.1 trillion
By 2036, interest payments alone will exceed the COMBINED cost of Medicare, Medicaid, and defense spending.
Annual Interest Payments on US Debt (2020-2036)
Interest costs have tripled since 2020 and will double again by 2036
CBO Baseline Projections, US Treasury Data, Peter G. Peterson Foundation
What Does $981 Billion in Annual Interest Buy?
The US pays more in interest on the debt than it spends on most major programs
| Metric | Interest on Debt | Medicare | National Defense | Veterans Benefits | Education Dept. | NASA |
|---|---|---|---|---|---|---|
| Annual Spending (Billions) | 981/1000 | 874/1000 | 873/1000 | 301/1000 | 79/1000 | 25/1000 |
Debt-to-GDP Ratio: We Owe More Than We Produce
The most important metric for national debt isn't the absolute number—it's the debt-to-GDP ratio. This tells us: how much does the government owe relative to the size of the entire economy?
Current Ratio: 128% (as of Q4 2025)
This means the US government owes $1.28 for every $1.00 the entire economy produces in a year. This is the highest peacetime debt-to-GDP ratio in American history.
Historical Context: - 1946 (Post-WWII Peak): 119% — We borrowed massively to win the war, then paid it down during the postwar boom - 1980s (Reagan Era): 40% → 60% — Rose due to tax cuts and defense spending - 2008 Financial Crisis: 60% → 100% — Jumped due to recession, bailouts, and stimulus - 2020 COVID Pandemic: 100% → 133% — Spiked to all-time high due to massive relief spending - 2026 (Today): 128% — Declining slightly from pandemic peak but still historically extreme
Economists generally agree that a debt-to-GDP ratio above 90% starts to slow economic growth. Above 120%, you enter dangerous territory where interest costs begin to crowd out productive investment.
The most important metric for national debt isn't the absolute number—it's the debt-to-GDP ratio.
US Debt-to-GDP Ratio (1980-2026)
The ratio has nearly tripled since 1980 and now exceeds post-WWII peak
US Treasury, Bureau of Economic Analysis, Pew Research Center
The Debt Spiral: Why This Gets Worse on Its Own
What Could $38.86 Trillion Buy? Relatable Comparisons
To understand the scale of $38.86 trillion, here's what that money could buy:
Education: - Fund free four-year college tuition for every American student for the next 387 years - Or pay off all $1.77 trillion in US student loan debt 22 times over
Infrastructure: - Build the entire US Interstate Highway System 700 times (original cost: $129B inflation-adjusted) - Or construct 25,906 new hospitals at $1.5 billion each
Housing: - Buy every single residential property in America (estimated $43 trillion total value) and still have money left over - Or build 97 million new homes at $400,000 each—enough to house every American household twice
Space Exploration: - Fund the entire Apollo program 1,214 times (cost: $32B inflation-adjusted) - Or build 259 James Webb Space Telescopes (cost: $10B each)
Everyday Items: - Buy 9.7 billion new cars at $40,000 each (the US has 290 million cars) - Or purchase 389 billion iPhone 15 Pros at $999 each—51 phones for every person on Earth - Or provide 3,886 billion Chipotle burritos—515 burritos for every human currently alive
Where Did the $38.86 Trillion Come From?
Major contributors to debt growth by presidential administration and crisis periods
US Treasury Historical Debt Outstanding (debt increases by period)
Historical Perspective: How We Got Here
The US has carried debt since its founding. After the Revolutionary War, the debt was $75 million—borrowed primarily from France and domestic investors. For most of US history, debt spiked during wars and fell during peacetime.
Major Debt Growth Periods:
1. World War II (1941-1945): Debt-to-GDP hit 119% to finance the war effort. This was sustainable because: (a) it was temporary, (b) the postwar boom generated massive tax revenue, and (c) we were investing in winning an existential conflict.
2. Reagan Era (1980s): Debt tripled from $914 billion to $2.87 trillion due to large tax cuts combined with increased defense spending during the Cold War.
3. Financial Crisis (2008-2010): Debt jumped from $10 trillion to $14 trillion due to bank bailouts, the stimulus package, and collapsed tax revenues during the Great Recession.
4. COVID-19 Pandemic (2020-2021): Debt exploded from $23 trillion to $28 trillion in just two years—the fastest growth in US history—due to stimulus checks, PPP loans, unemployment benefits, and revenue collapse during lockdowns.
5. Post-COVID Era (2021-2026): Debt continued climbing from $28 trillion to $38.86 trillion despite economic recovery, driven by continued deficit spending, rising interest costs, and entitlement program growth.
The difference between now and WWII: we're not fighting an existential war, the economy isn't booming, and we're not paying it down.
The difference between now and WWII: we're not fighting an existential war, the economy isn't booming, and we're not paying it down.
US National Debt Milestones
Revolutionary War Debt
$75 million owed to France and domestic lenders
Debt Reaches Zero
Only time in US history the national debt was fully paid off (under Andrew Jackson)
WWII Peak
$269 billion debt, 119% of GDP—highest ratio until 2020
Modern Era Begins
$914 billion—debt begins exponential growth period
First $10 Trillion
Financial crisis pushes debt past $10 trillion milestone
First $30 Trillion
COVID spending drives debt past $30 trillion in February
First $38 Trillion
Debt reaches $38 trillion in October, growing $7B+ per day
Interest Exceeds Defense
Annual interest payments ($1T) surpass defense spending for first time
The Bottom Line: Why This Matters to You
Most Americans don't think about the national debt because it feels abstract—something for politicians and economists to worry about. But the debt affects your life in concrete ways:
Higher Taxes (Eventually): There are only three ways to handle debt: grow the economy faster than the debt (not happening), cut spending (politically toxic), or raise taxes (inevitable at some point).
Lower Government Services: As interest payments consume more of the budget (13% now, 25% by 2036), there's less money for roads, schools, research grants, and safety net programs.
Weaker Economy: High government borrowing competes with private borrowing, driving up interest rates for mortgages, car loans, and business loans. This slows economic growth.
Risk of Crisis: If investors lose confidence in US debt, interest rates could spike suddenly—triggering a debt spiral where rising rates make the debt unpayable, forcing either default, hyperinflation, or draconian austerity.
Generational Theft: Today's spending is paid for by tomorrow's workers. Millennials and Gen Z will spend their working lives paying interest on programs they never benefited from.
The national debt is $38.86 trillion. That's not 38.86 billion with extra zeros. It's a fundamentally different number that requires fundamentally different thinking. And it's growing by $70,843 every single second.
Debt Crisis Indicators: How Close Are We?
| Indicator | Current Level | Warning Threshold | Status |
|---|---|---|---|
| Debt-to-GDP Ratio | 128% | >90% slows growth | ⚠️ Danger |
| Interest as % of GDP | 3.3% | >4% is critical | ⚠️ Warning |
| Interest as % of Revenue | 18.6% | >20% is severe | ⚠️ Warning |
| Interest as % of Spending | 13% | >15% is crisis | ⚠️ Approaching |
| Primary Deficit | -$600B/yr | Should be surplus | ❌ Failure |
| Debt Growth Rate | +7.3%/yr | Should be <GDP growth | ❌ Unsustainable |
What real people think
DividedSourced from Reddit, Twitter/X, and community forums
Economists universally agree the debt trajectory is unsustainable, but disagree sharply on solutions and urgency. Progressive economists emphasize the low real cost of borrowing and productive investment potential. Conservative economists warn of imminent crisis. The public is largely unaware of the scale because the consequences feel distant.
Projects interest costs will reach $2.1 trillion by 2036 and warns that 'the rising debt leads to growing interest costs, which threaten to crowd out opportunities for investment.' CBO's baseline assumes current laws remain unchanged.
Argues the US is approaching a 'debt spiral' where interest grows faster than GDP within 5 years. Calls for immediate deficit reduction plan to put debt on sustainable path before crisis forces painful austerity.
Argue that debt in your own currency isn't inherently dangerous and that the US can 'print money' to service debt without default risk. Emphasize that real constraints are inflation and resource availability, not debt levels.
Notes that interest payments now exceed Medicare and defense spending and will soon consume 25% of all federal revenue. Warns this represents 'one of the most consequential fiscal emergencies in the country's history.'
Polls show most Americans express concern about debt in abstract terms but rank it below healthcare, inflation, and jobs as immediate priorities. Few understand the difference between trillion and billion.
Sources
- 1.U.S. Treasury Fiscal Data - Debt to the Penny
- 2.Joint Economic Committee - National Debt Reaches $38.86 Trillion (March 2026)
- 3.Congressional Budget Office - Interest Costs Projections
- 4.Peter G. Peterson Foundation - Interest Costs on National Debt
- 5.Pew Research Center - Key Facts About US National Debt
- 6.US Treasury - Historical Debt Outstanding
- 7.Federal Reserve Economic Data (FRED) - Total Public Debt
- 8.US Bureau of Engraving - Dollar Bill Specifications
Rate this article
Your feedback helps surface the best content
Related articles
Have a question? Get your own article.
Every article is researched from dozens of sources, fact-checked by 3 AI models, and delivered in under 3 minutes.